NASA September 2023 Temperature Data Shows Continued Record Warming

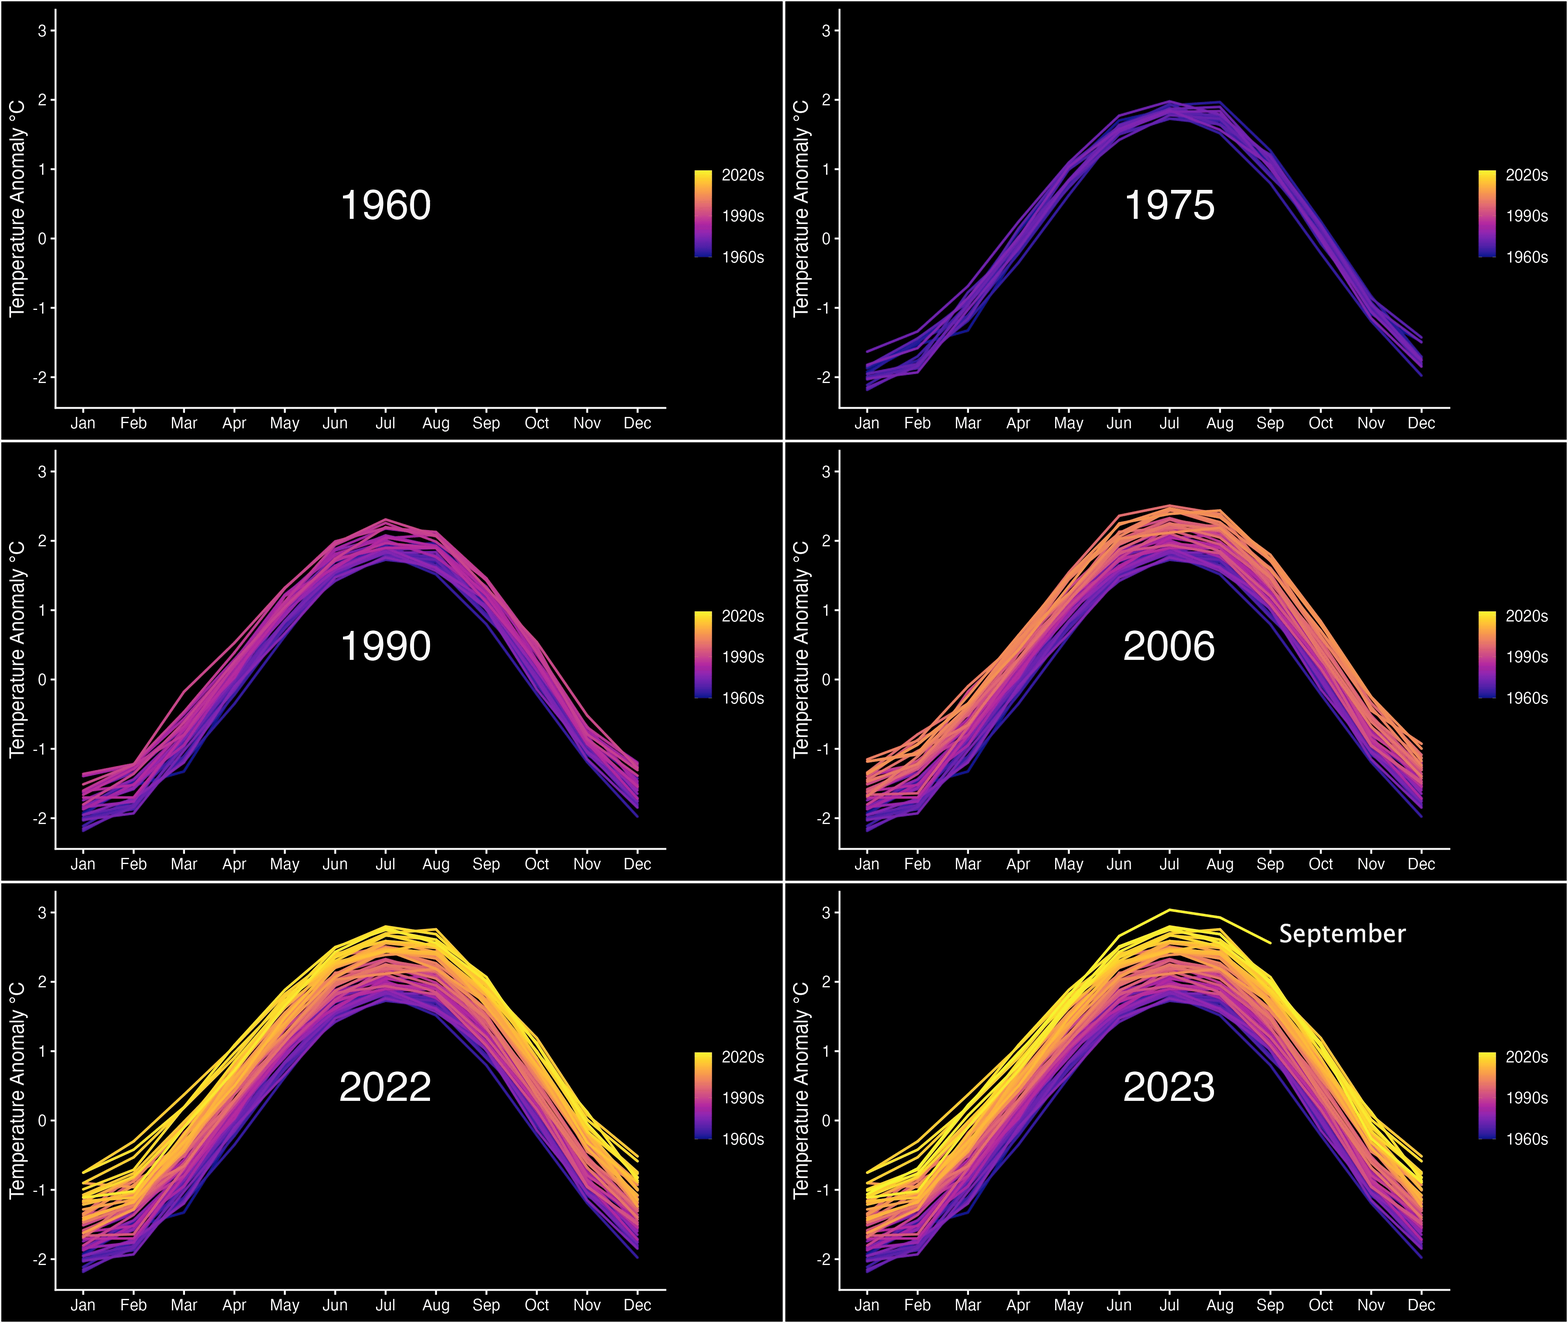
Continuing the temperature trend from this summer, September 2023 was the hottest September on record, according to scientists at NASA’s Goddard Institute for Space Studies (GISS). The month also set the record for the highest temperature anomaly – the largest difference from the long-term average.
This visualization shows global temperature anomalies along with the underlying seasonal cycle. Temperatures advance from January through December left to right, rising during warmer months and falling during cooler months. The color of each line represents the year, with colder purples for the 1960s and warmer oranges and yellows for more recent years. A long-term warming trend can be seen as the height of each month increases over time, the result of human activities releasing greenhouse gases like carbon dioxide into the atmosphere.
“What’s remarkable is that these record values are happening before the peak of the current El Nino event, whereas in 2016 the previous record values happened in the spring, after the peak,” said Gavin Schmidt, director of GISS. El Nino is the warm phase of a naturally recurring pattern of trade winds and ocean temperatures in the Eastern Tropical Pacific that influences global temperatures and precipitation patterns.
By Katy Mersmann
NASA Goddard
Share
Details
Related Terms
First published at NASA.gov


